9.1.7. Custom Report Table Views
Introduction
You can convert a Custom Report to a Table View for more sorting, filtering, grouping or data analyzing features. Adding # char in front of a table name converts report to a table.
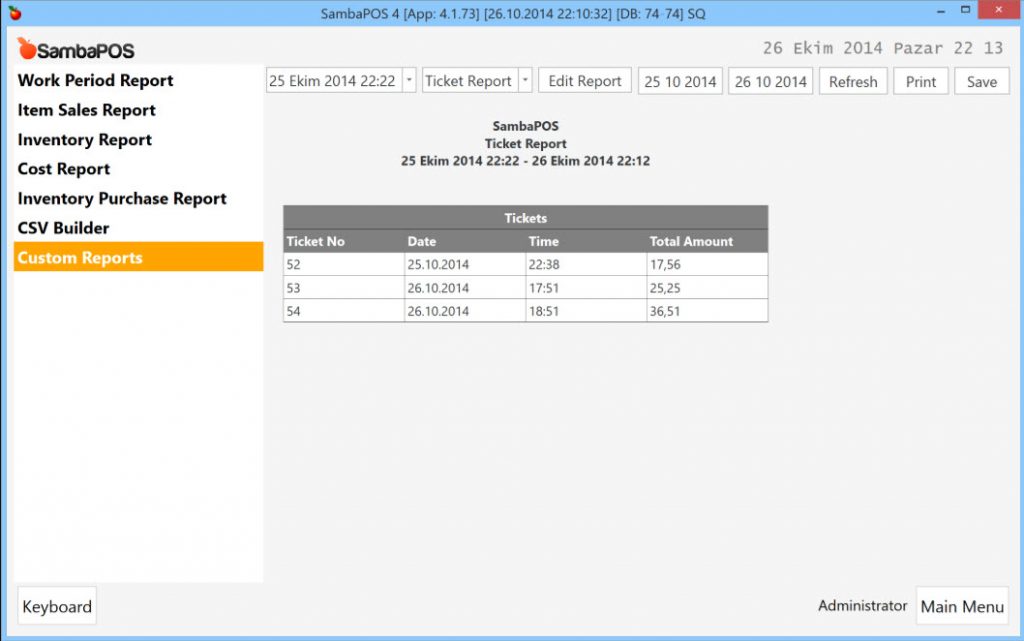
This is a simple custom report that lists tickets in date range. In here it is used this Custom Report Template to generate that report.
[Tickets:1,1,1,1] |
You can convert this report to a table by adding # in front of table name. So [Tickets:1,1,1,1] line becomes [#Tickets:1,1,1,1].
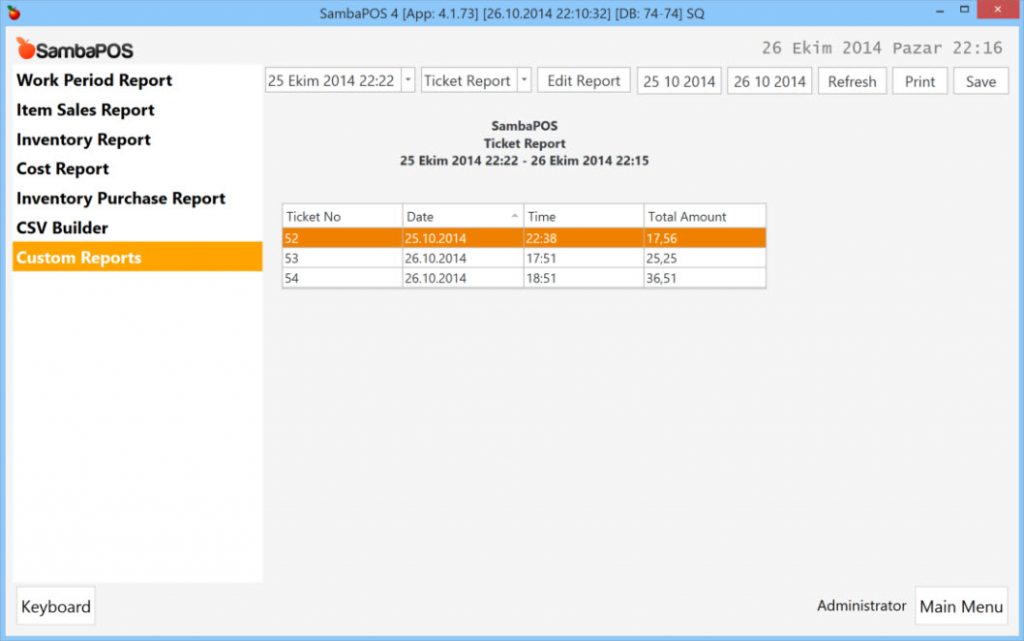
You can click column headers for sorting or right click on headers for advanced options.
Setting Column Types
You can see on the screen shots Total Amount column is left aligned. That means our table processes this value as a string value. You can set type of a column by using column type indicators. It will be added [C] in front of Total Amount header to format this value as Currency.
[Tickets:1,1,1,1] |
You can use [N] to format a column as a Numeric column. Useful for formatting non financial numbers such as quantities.
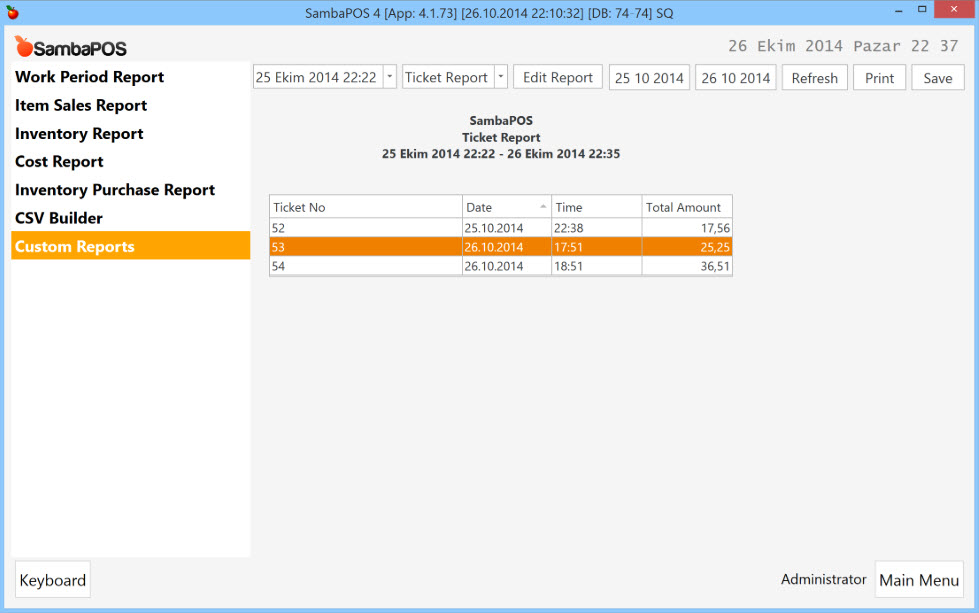
Now Total Amount column recognized as a currency column. In further sections it will be seen how to enable total summary footer for that column.
Setting Table Height
In table view mode you can set a height for the table.
[#Tickets:1,1,1,1:500] |
500 means 500px height. If you do not set a value default value is 300px and if you set it as 0 table will have unlimited height. Table width is determined by report width.
Changing & Saving Table Settings
You can resize columns, change order, change grouping or change sorting. If you want to store these settings right click on table and click Save Settings command.
By clicking View Editor commands you can enable advanced editing mode. You’ll find a lot of settings there.
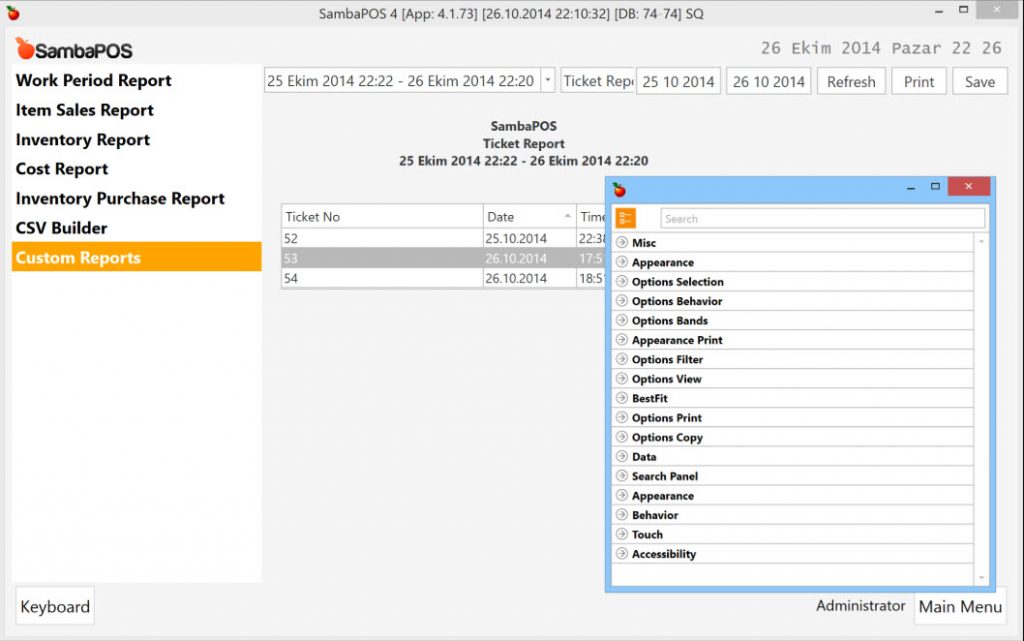
Here are some useful settings. You can type their name on search box to find them easily.
| ShowSearchPanelMode | Default-Always-Never | Displays search panel. |
| ShowVerticalLines | True-False | Displays Vertical Lines or not. |
| ShowHorizontalLines | True-False | Displays Horizontal Lines or not. |
| ShowColumnHeaders | True-False | Displays Column Headers or not. |
| ShowIndicator | True-False | Displays Row indicator. |
| AutoWidth | True-False | Automatically fits column widths to table width. |
| ShowAutoFilterRow | True-False | Displays excel like auto filter row to filter rows. |
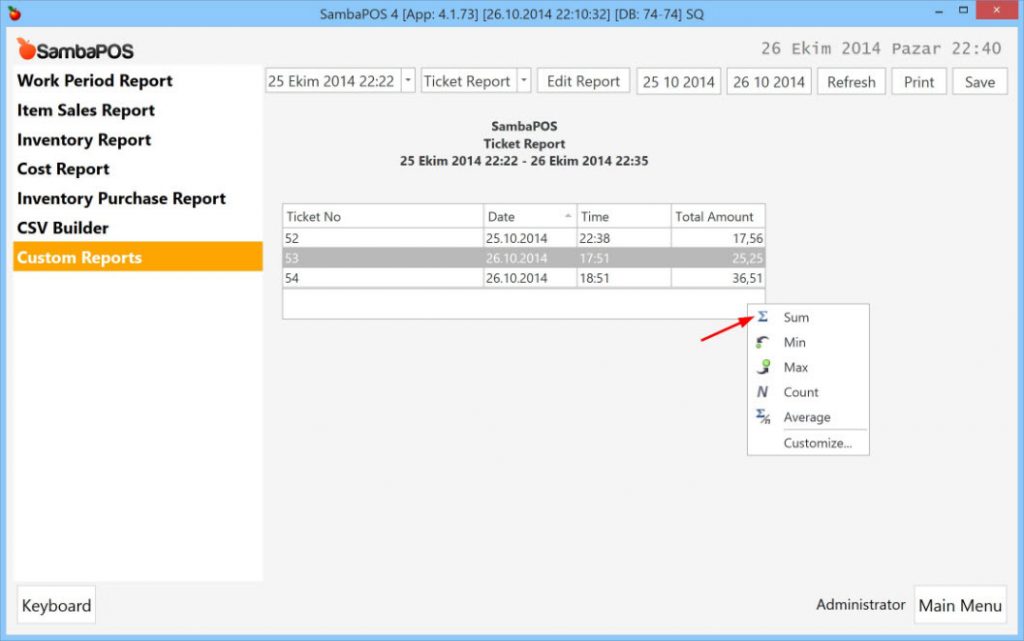
Formatting Total Summaries
When you enable View Editor > ShowTotalSummary setting a footer bar will appear. Right click under Total Amount column and choose Sum.
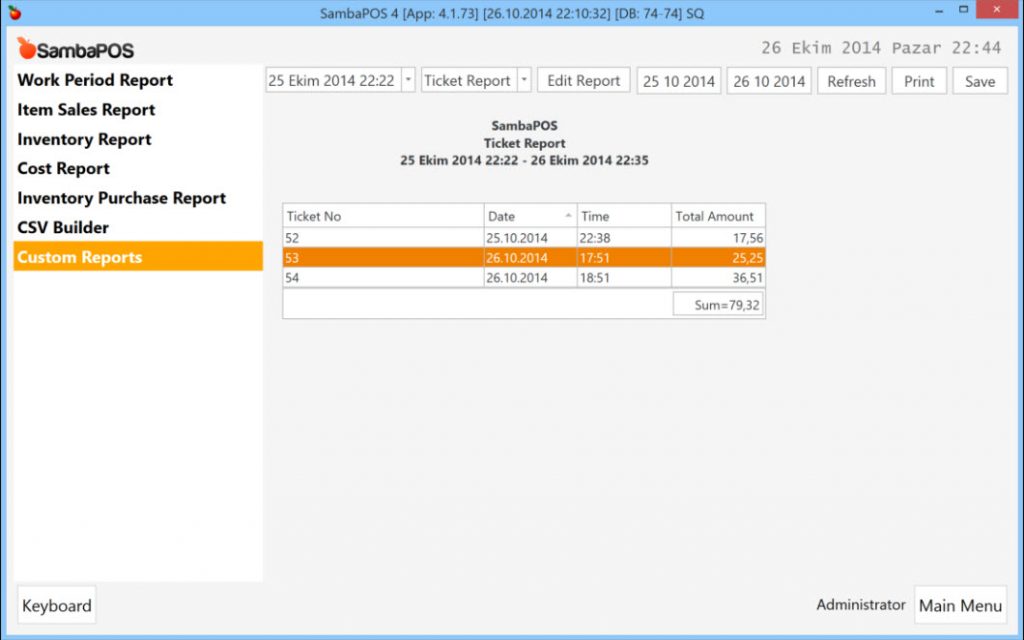
That will display the sum of Total Amount column.
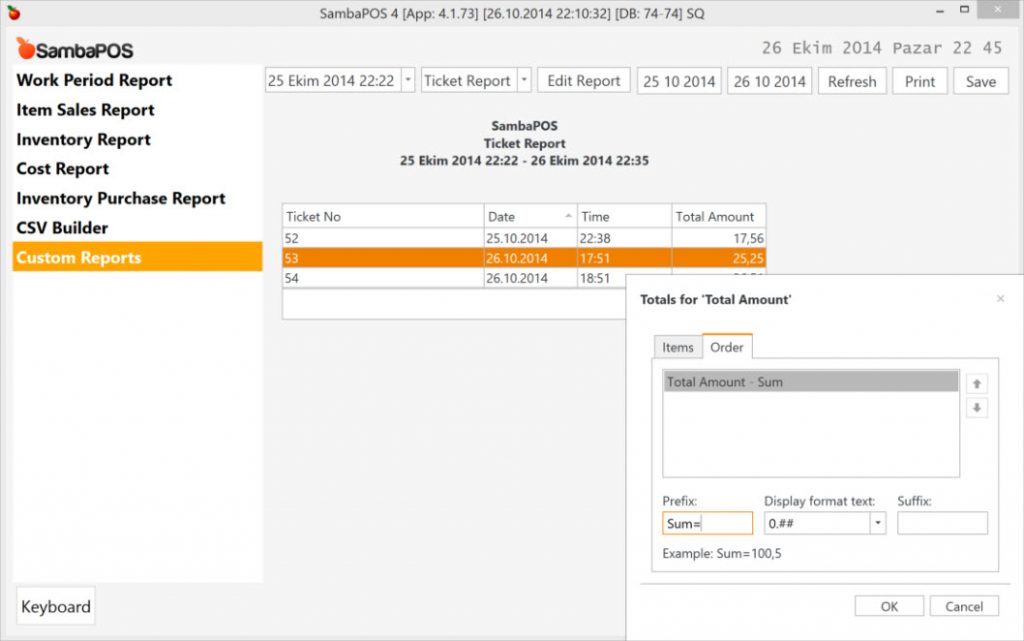
Click Customize to change how sum value appears.
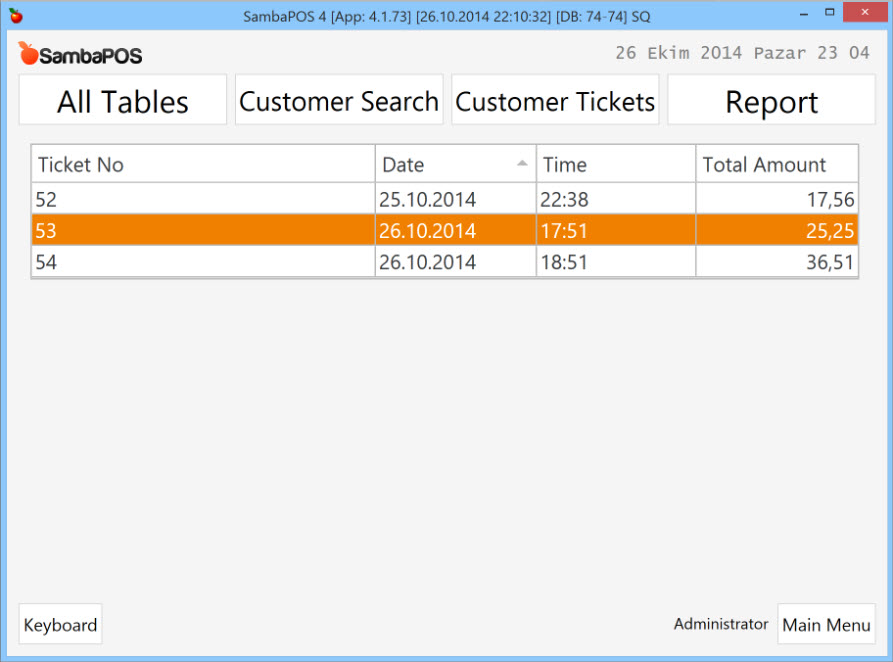
Custom Report Widget Settings for Table View
It is possible to add this report as a Widget in a Custom Entity Screen. Custom Report Viewer Widget displays custom reports in entity screens.
You can use this table for advanced UI customization.
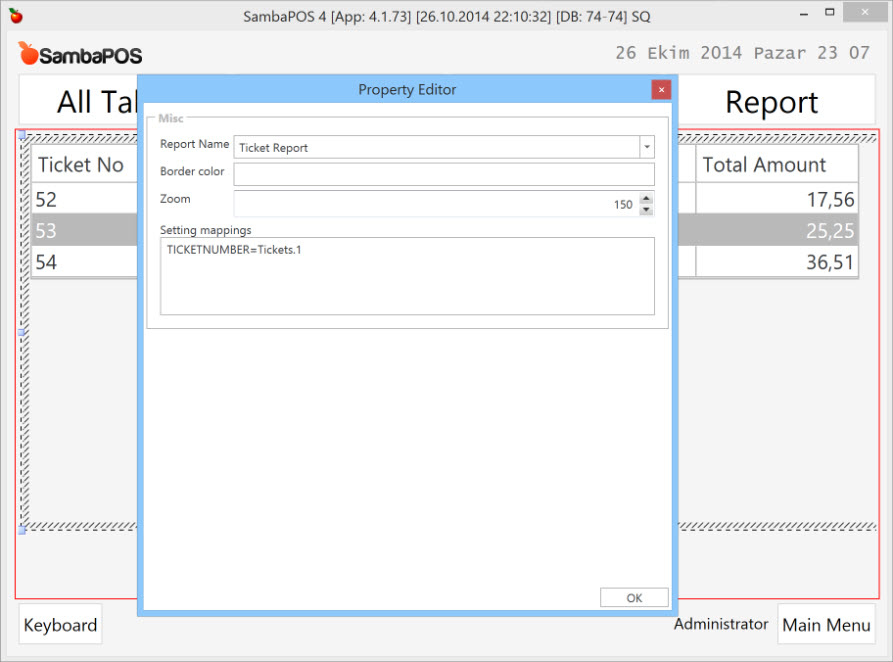
Setting Mappings
Syntax: <setting name>=<table name>.<field no>
In Setting Mappings editor you can map table column values to Custom Settings. TICKETNUMBER=Tickets.1 means we can access 1st value of Tickets table (we named it as Tickets inside report template) with [:TICKETNUMBER] tag. As 1st field is in our report template is TicketNumber, TICKETNUMBER setting becomes selected row’s Ticket Number value as we navigate through rows. You can map multiple values to different settings by adding a separate line for each setting in Setting Mappingseditor.
Tip; Field numbers are relative to report template. Changing column orders or visibility through table settings won’t change field numbers.