9.1.6. Custom Report Pivot Table Views
Pivot tables are useful to create different views of data easily for better analyzing data.
Preparing a Sample Report
You can create a simple Orders report by using this custom report template.
[Orders:1,2,1,1] |
This report will list all orders we’ve placed inside selected date range.
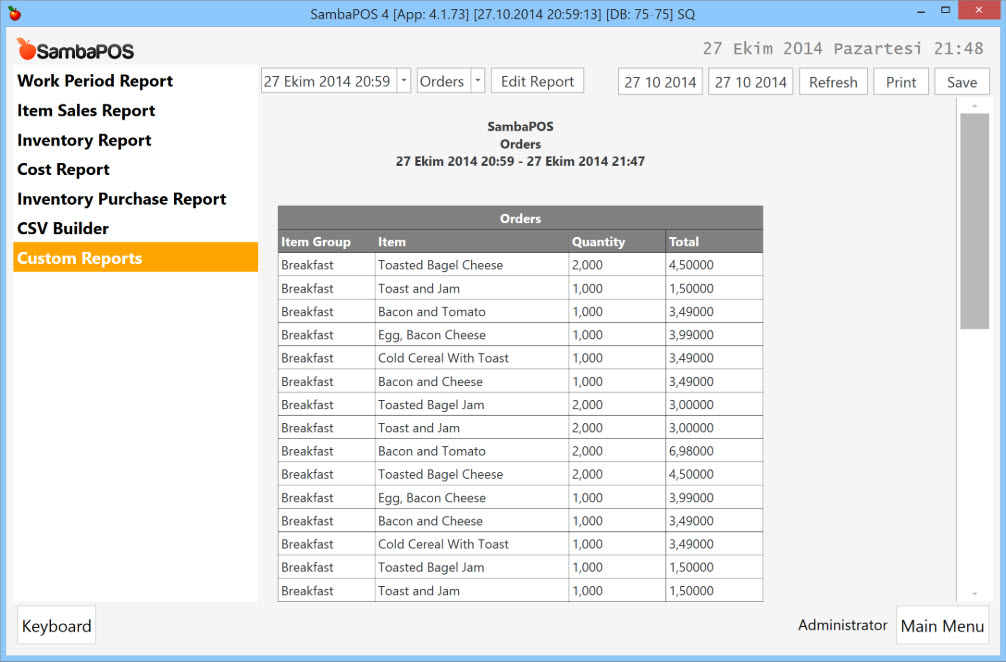
Converting Report to a Pivot Table
Pivot Table is useful to create summary reports. You can convert this report to a Pivot Table by adding ! char in front of table name. So [Orders:1,2,1,1] part of the template becomes [!Orders:1,2,1,1]. When you save your report Custom Report converts to a Pivot Table.
Report will display nothing as you need to configure row and value fields.
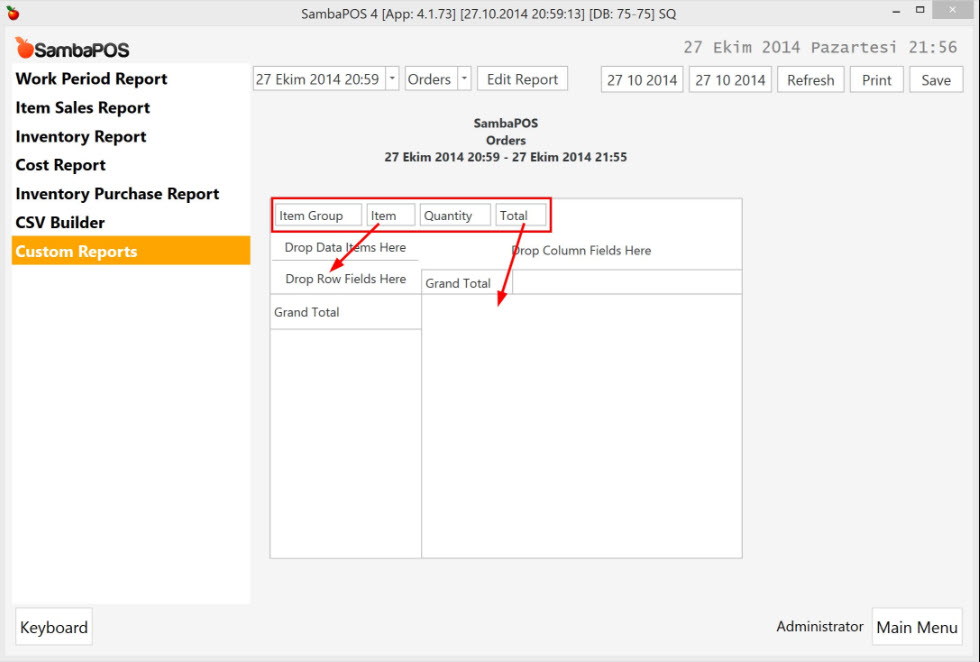
A pivot table contains three areas.
-
Rows Area: Move fields here which you want to list in the table. In this sample it’ll be listedMenu Items. -
Values Area: Move numeric fields here which you want to see totals. In this sample it is desired to see sum ofTotalfield for each menu item (for values that has been added to rows.) -
Columns Area: Move fields here which you want to see totals in intervals. For example you can moveDatevalues here to display periodic totals.
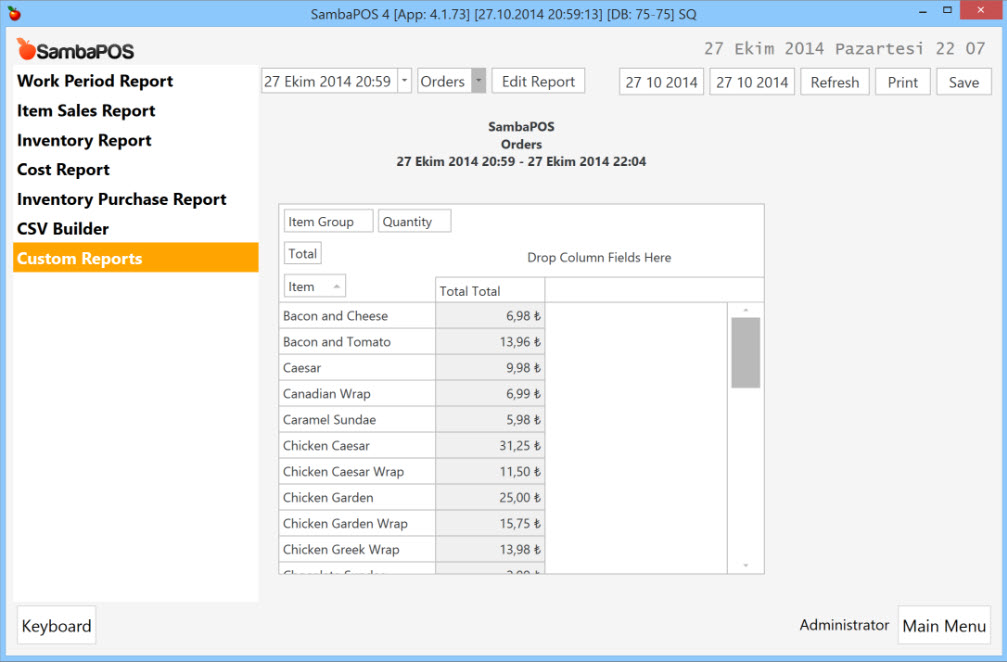
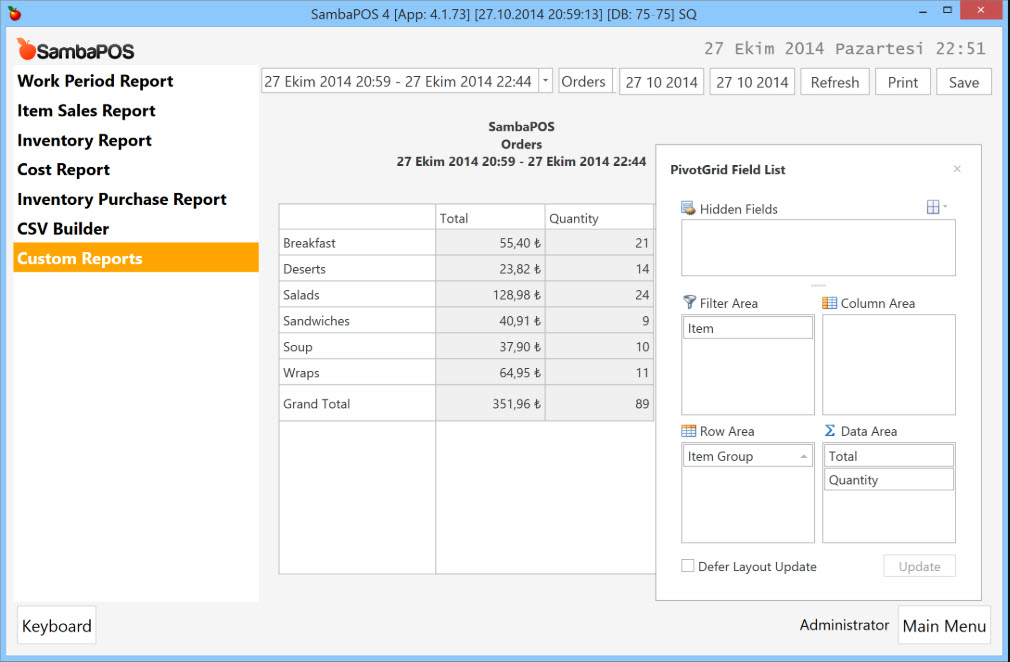
If you want to list Menu Item Names on rows and see the sum of Total Values. You need to drag & drop Item Column to the area labeled as Drop Row Fields Here. You should also drag & drop Total inside table.
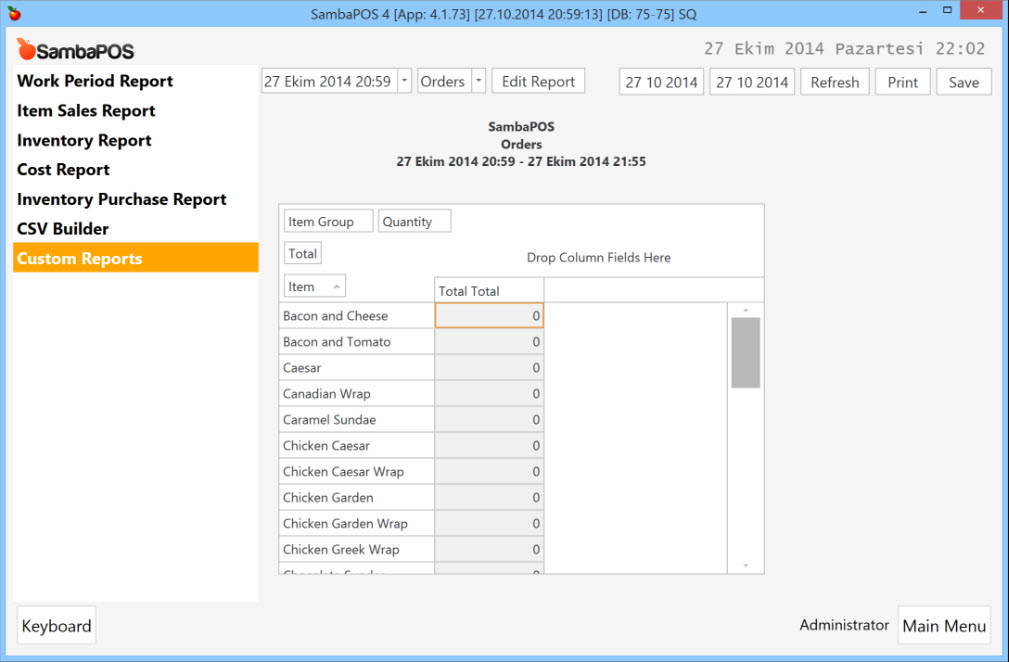
Defining Value Types
Report displays 0 as Totals. This is because report processes these values as alphanumeric values. You can set column formats by using column type identifiers. On header row you need to use [N] (number) for Quantity and [C] (currency) for Total. Before doing it right click on value area and click Save Changes to store your changes.
[Orders:1,2,1,1] |
After this change you’ll see totals for each Menu Item.
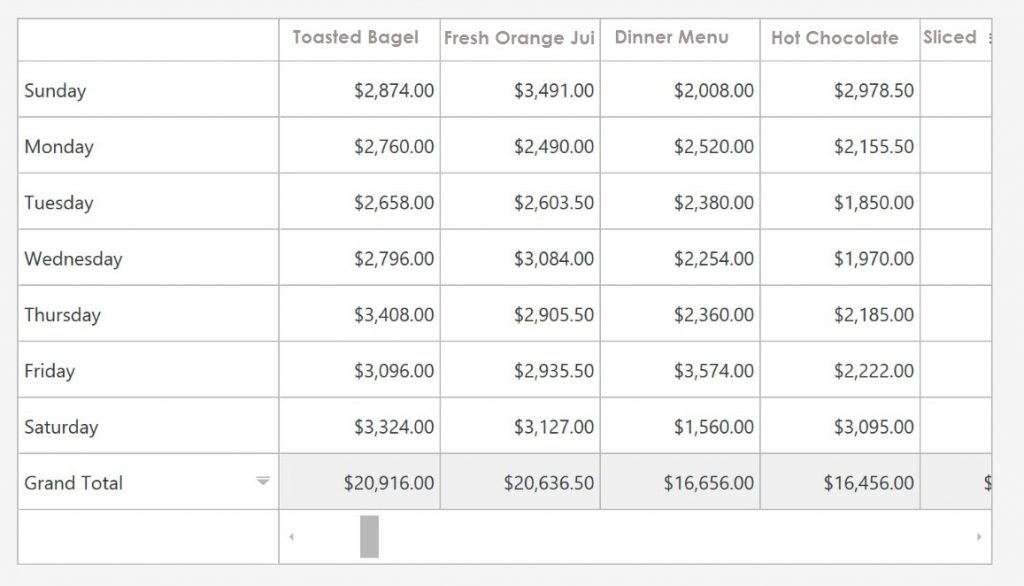
Tip; If you need to see periodical totals (eg.daily) you can include O.Date field inside report template, configure column type as [D] and drag this value to Columns area.
Adding More Fields
On this step Item Group will be moved to the Rows area in front of Item field. Also Quantity field will be moved to Values area.
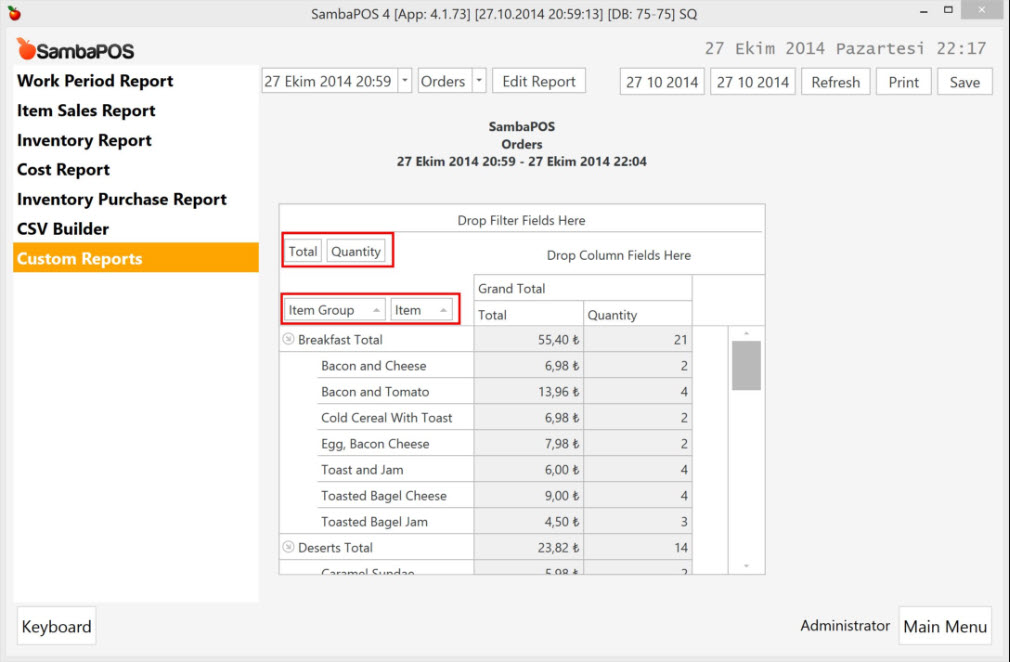
Pivot Table beautifully displays Items grouped by Item Groups, display separate totals for each group and also displays quantity totals.
Tip; Don’t forget to click Save Changes to store your changes.
Advanced Configuration
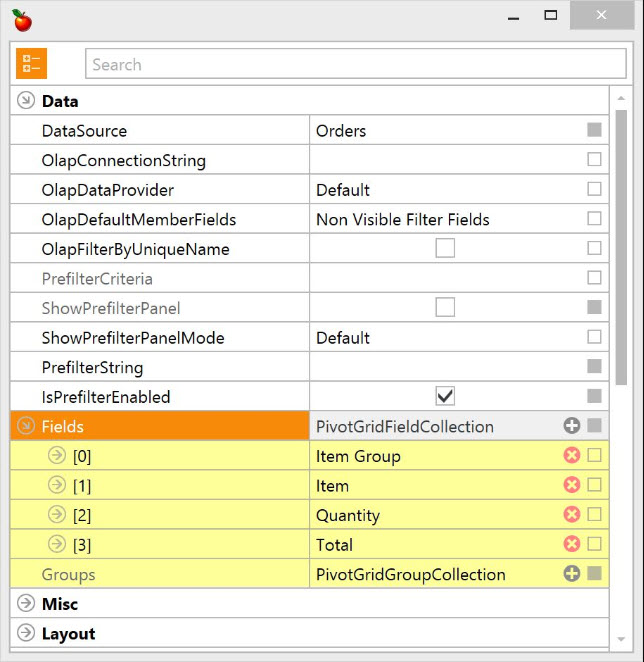
You can right click on value area and click Design Mode to see some advanced settings.
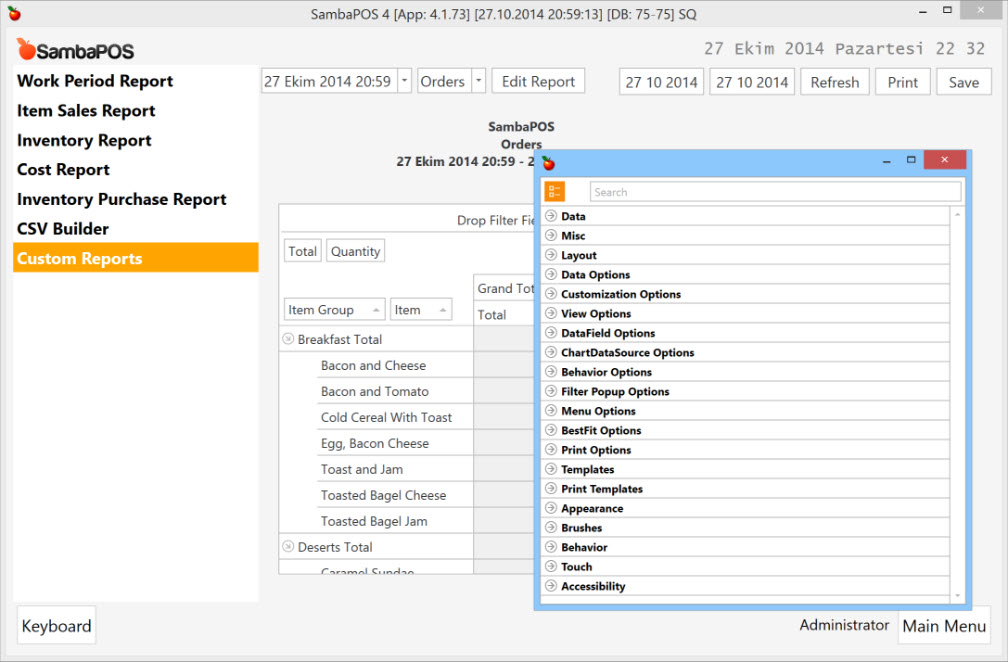
You’ll see a lot of settings here. For easier finding settings you can use Search editor to search for settings by it’s name.
Changes you’ll make on pivot grid will saved to database so these changes will be available to all terminals.
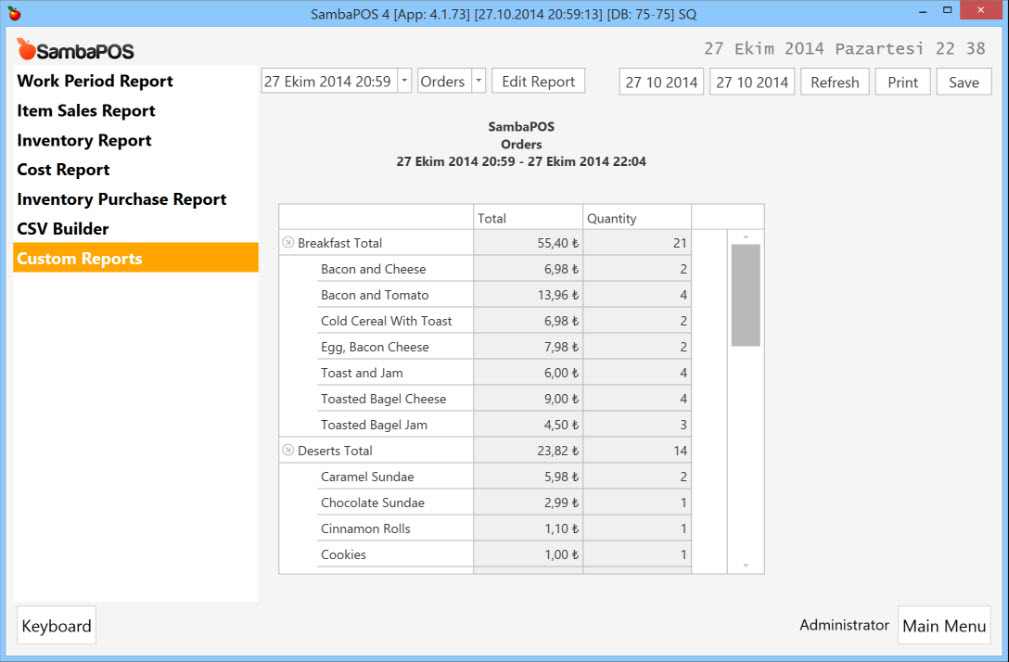
Header Visibility Settings
When you complete designing your report, you can hide field dropping areas for better view.
| ShowColumnHeaders | Disable to hide column header dropping area. |
| ShowDataHeaders | Disable to hide value dropping area. |
| ShowFilterHeaders | Disable to hide unused fields area. |
| ShowRowHeaders | Disable to hide row dropping area. |
| ShowColumnGrandTotalHeader | Disable to hide Grand Total header from columns. |
| ShowRowGrandTotalHeader | Disable to hide Grand Total header from rows. |
You can have a simpler view by disabling these settings.
Tip; If you need to make changes on fields you also use Show Field List Context Menu item. By using field selection window you can make changes without the need of enabling these fields.
Field Specific Settings
Each fields have some additional settings that can be used for changing formatting or calculation. You can access field specific settings through Design Mode > Data > Fields.
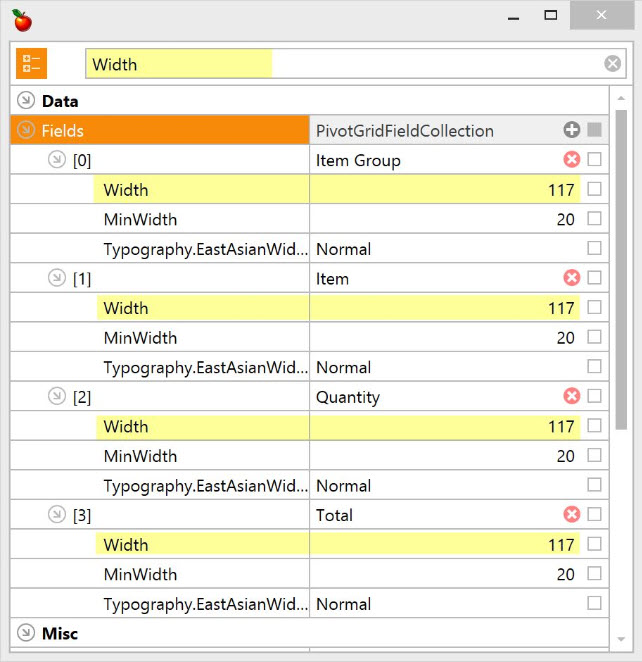
To change settings of multiple fields easily you can type setting name on top.
Here are some useful settings.
| Width | For setting a width for a field. Changes made by dragging column boundaries won’t saved. |
| Cell Format | For changing display format of values. You can use standard formatting strings here. For example not to display decimal places you can use # format. |
| Running Total | Displays running totals. |
Changing Summary Type
By changing Summary Type setting of a field you can change how values calculates. Possible values are:
-
Count: Displays total count of items. -
Sum: Displays sum of values. -
Min: Displays minimum value. -
Max: Displays maximum value. -
Average:Displays average value. -
Std Dev:A statistical function that displays standard deviation. -
Var: A statistical function that displays variation.
Changing Summary Display Type
You can change how summaries displays. For example instead of displaying sum of total value we can display percent value for sum.
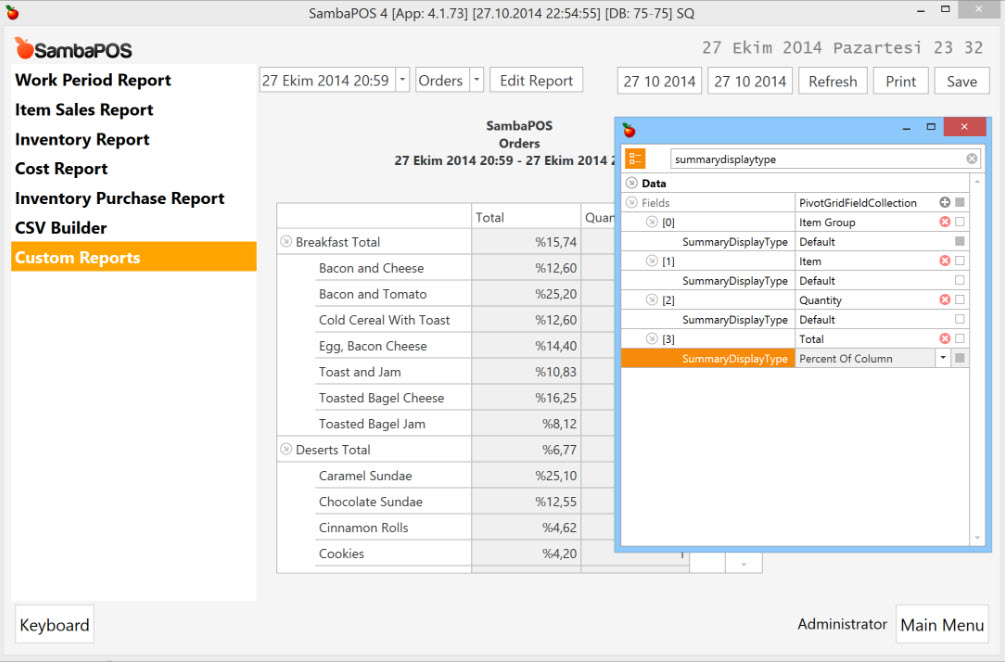
In this sample it will be displayed percent of column value instead of totals.
Tip; For displaying both total and percent values you can add multiple total fields from report template. You can also use ..Variation settings to display how (+,- or %) data changes between intervals.
Possible values for summary display type setting are: Absolute Variation, Percent Variation, Percent of Column, Percent of Row, Percent of Row/Column Grand Total, Rank in Column/Row from Smallest to Largest.
Changing Group Interval
By changing group interval setting of a field you can change how data displays in intervals. For example for date fields you can change summary intervals as day, week, month to analyze daily, weekly, monthly totals. Possible values are. Date, Date Day, Date Day of Week, Date Day of Year, Date Week of Month, Date Week of Year, Date Month, Date Quarter, Date Year, Year Age, Month Age, Week Age, Day Age, Numeric, Hour, Minute, Second and Alphabetical.
By using Alphabetical interval you can group items Alphabetically.
This sample displays Date interval by Week Days.