9.1.1. Custom Report Templates
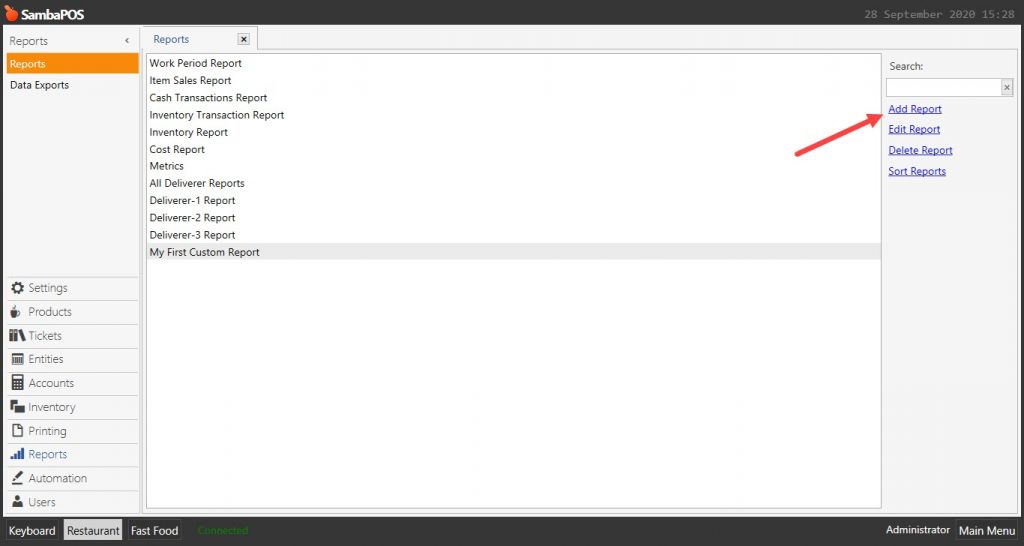
Main Menu > Manage > Reports > Add Report >
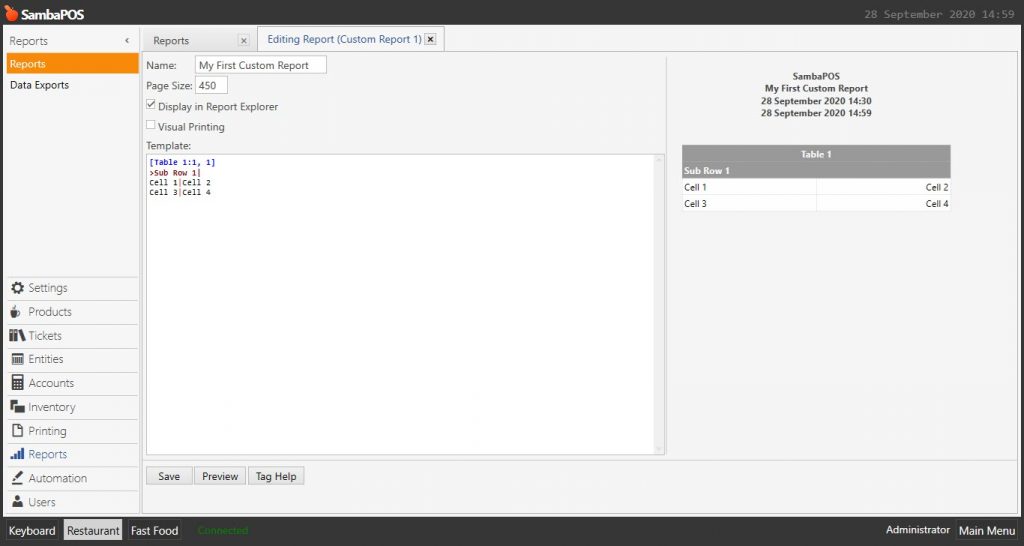
Add this Custom Report Template inside report.
Custom Report 1
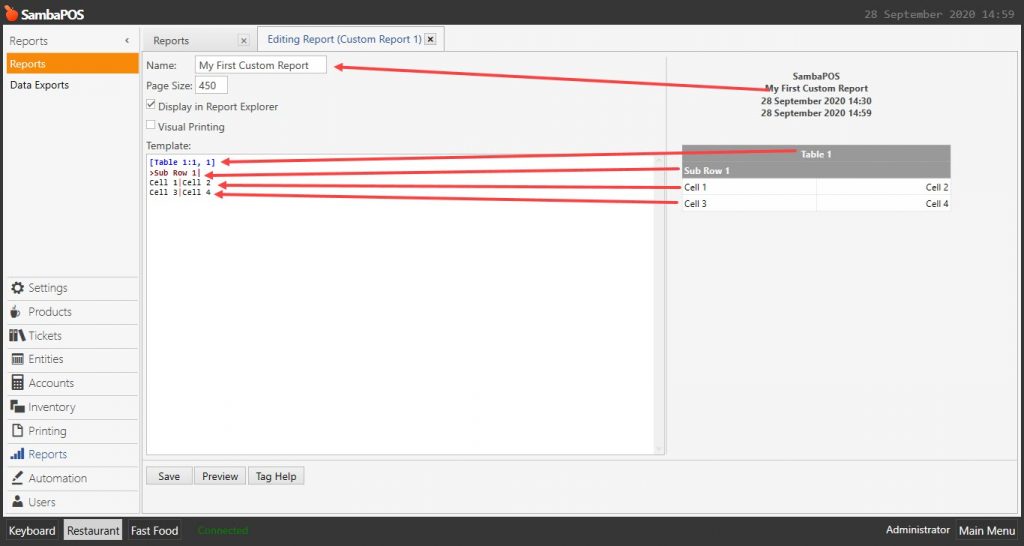
[Table 1:1,1]

>Sub Row 1|

Cell 1|Cell 2

Cell 3|Cell 4
This is what each template line displays.
Formatting Tables
When you add a Table Section all lines added under that section will appear as a table row. The Syntax for Table Section is
[Table Name:Columns]
While defining columns you also define columns sizes. If you need two columns with same size you’ll add 1,1.
[Table Name:1,1]
Column sizes are defined as percents. Percent = Total number of sizes / Column Size. So it will create two columns with %50 size.
Examples:
[Table Name:2,1]

it will create two columns. 3/2 (%66) for first column and 3/1 (%33) for second column.
[Table Name:2,1,2]

It will create three columns. 5/2 (%40) for first, 5/1 (%20) and 5/2 (%40) for third column.
Formatting Rows
Row values are delimited with | (pipe)char. The number of pipes for each row should match table’s column count -1
[Table 1:1,1] --- Creates Two Columns

Cell 1|Cell 2 --- Has Two values separated with | char.
Spanning Rows
Empty Values will Span. Cell counts should match with column count
Examples
[Table 1:1,1] |
[Table 1:1,1,1] ---- Three Columns |
Bold Rows
Adding > char before a row will display it as a highlighted bold row. Useful for highlighting headers, splitting reports to sections or highlighting totals.
Multiple Tables
A custom report may contain multiple tables.
[Table 1:1,1]

Value 1|Value2
[Table 2:1,1]

Value 3|Value4
Column Alignments
By default all columns are left aligned. If you add a space before column size value it will align to right. Generally it is used to align financial values to right for easier reading.
[Table 1:1, 1] ---- Second 1 starts with a space char

Value 1|Value2 ---- Value2 column will align to right.


