9.1.2. Creating Custom Reports with SQL
Adding SQL Scripts
You can display result of an SQL Script in custom reports. If SQL Scripts returns a single value you can use it as a cell value. If it returns multiple values that will be formatted as a table row. In other words SQL result will be converted to a list where each line contains | delimited cell values. So custom report engine can display them as table rows.
Creating an SQL script
Tip; In this section samples won’t be real SQL scripts. It will be just shown how you can display SQL results in custom reports.
Navigate to Management > Automation > Scripts to create a new script.
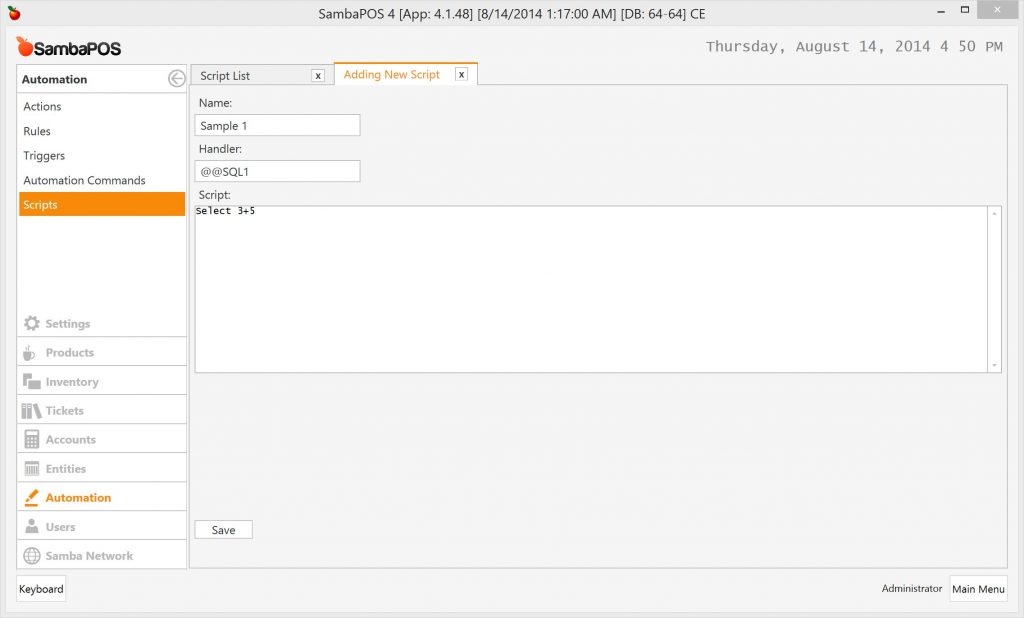
Select 5+3 script returns the result of calculation.
Tip; Handler is the name that will be referenced from reports. It should start with `@@` and should not contain spaces.
Tip; The reason for creating SQL Scripts outside reports is making scripts reusable so that they can be accessed from multiple reports.
After saving it you can access this script from custom report by using @@Handler_Name syntax. For this example @@SQL1 will display the result of the (5+3) calculation in reports.
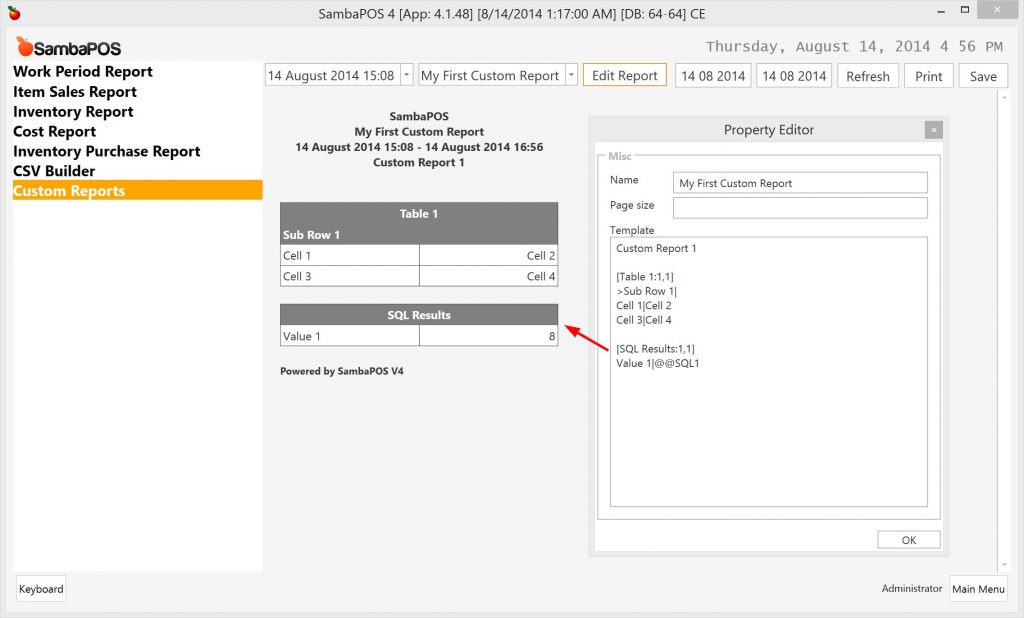
In the template we have this section.
[SQL Results:1,1]
Value1|@@SQL1     >>> @@SQL1 cell value replaces with the result of 5+3 calculation.
|
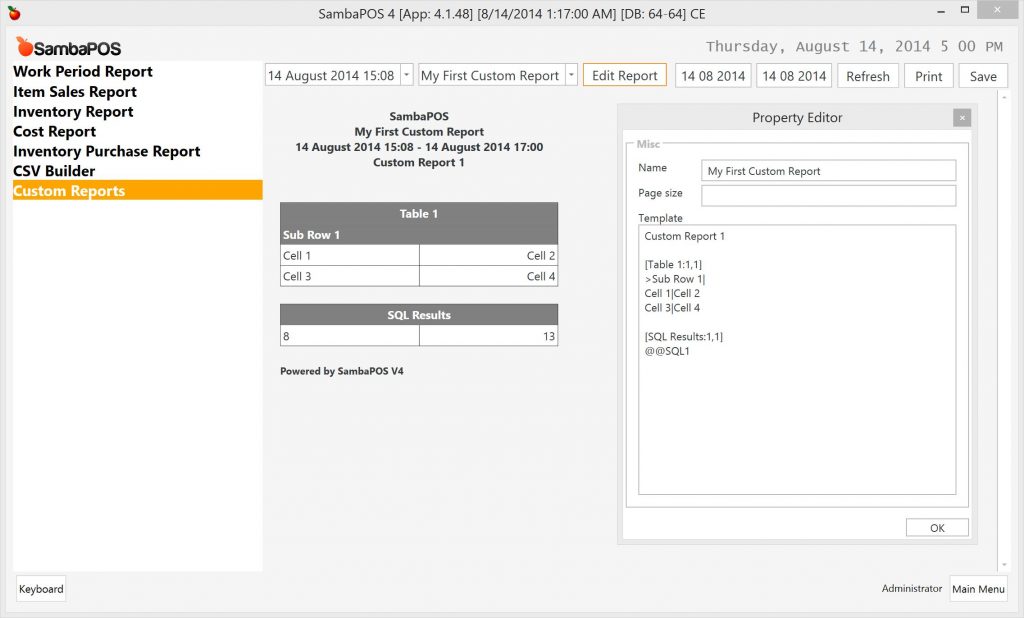
Since example table have 2 columns, it is possible to return 2 values as the result of @@SQL1 and use it as a row.
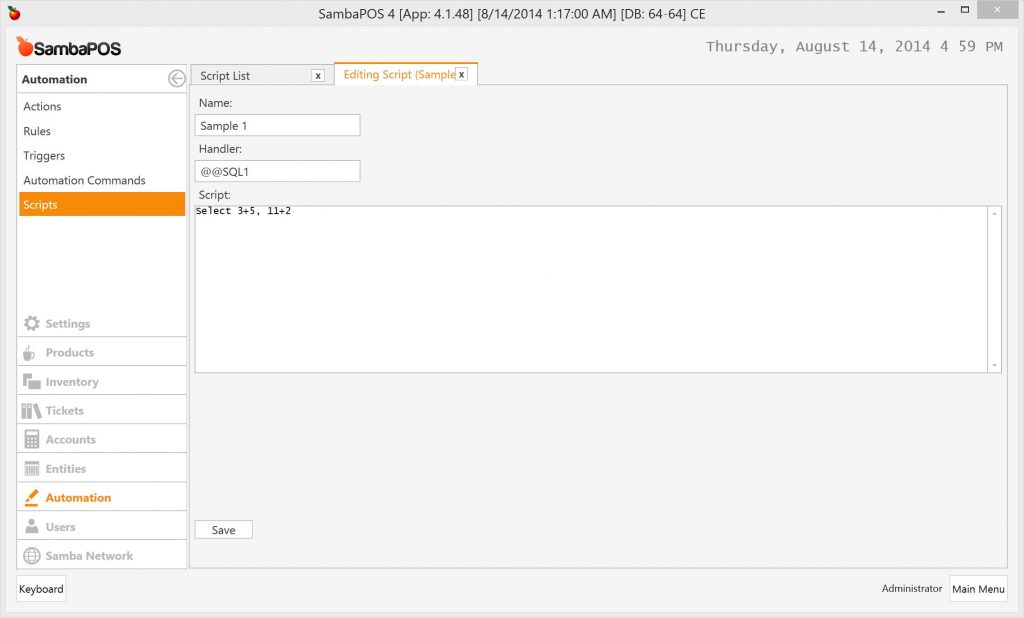
It has been added another expression to SQL script so it will return a single row with two columns. As it returns multiple values you can use it as whole row. SambaPOS will automatically convert result to a | delimited row as Value|Value2.
A Real Life Example
This script displays ticket counts by peak hours.
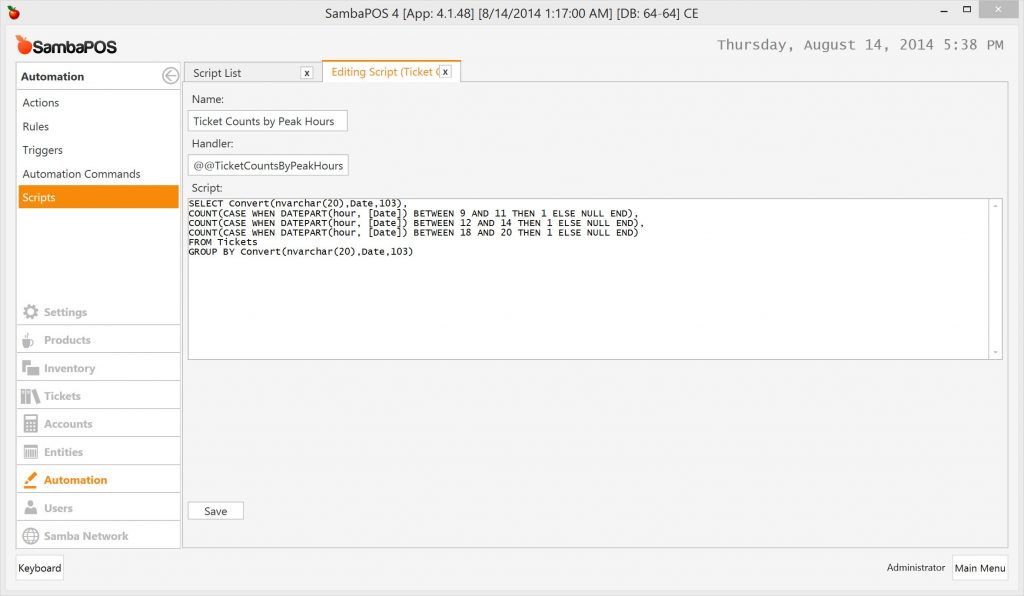
SELECT CONVERT(nvarchar(20),DATE,103),
  COUNT(CASE WHEN DATEPART(HOUR, [DATE]) BETWEEN 9 AND 11 THEN 1 ELSE NULL END),
  COUNT(CASE WHEN DATEPART(HOUR, [DATE]) BETWEEN 12 AND 14 THEN 1 ELSE NULL END),
  COUNT(CASE WHEN DATEPART(HOUR, [DATE]) BETWEEN 18 AND 20 THEN 1 ELSE NULL END)
FROM Tickets
  GROUP BY CONVERT(nvarchar(20),DATE,103)
|
This script returns 4 columns per row so it is necessary to prepare a 4 column table. A new report has been created by choosing Add Report from report selection drop down and named it as Ticket Counts by Peak Hours.
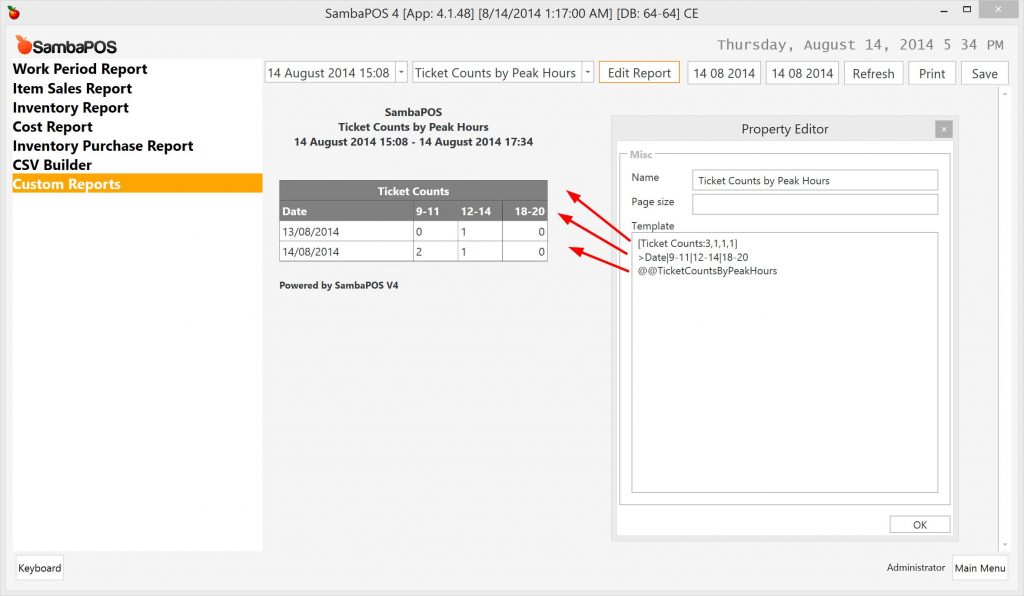
  [Ticket Counts:3,1,1,1]       >>> Table definition and column sizes.
  >Date|9-11|12-14|18-20        >>> Header row. Starts with > char.
  @TicketCountsByPeakHours      >>> SQL Script that returns rows.
|
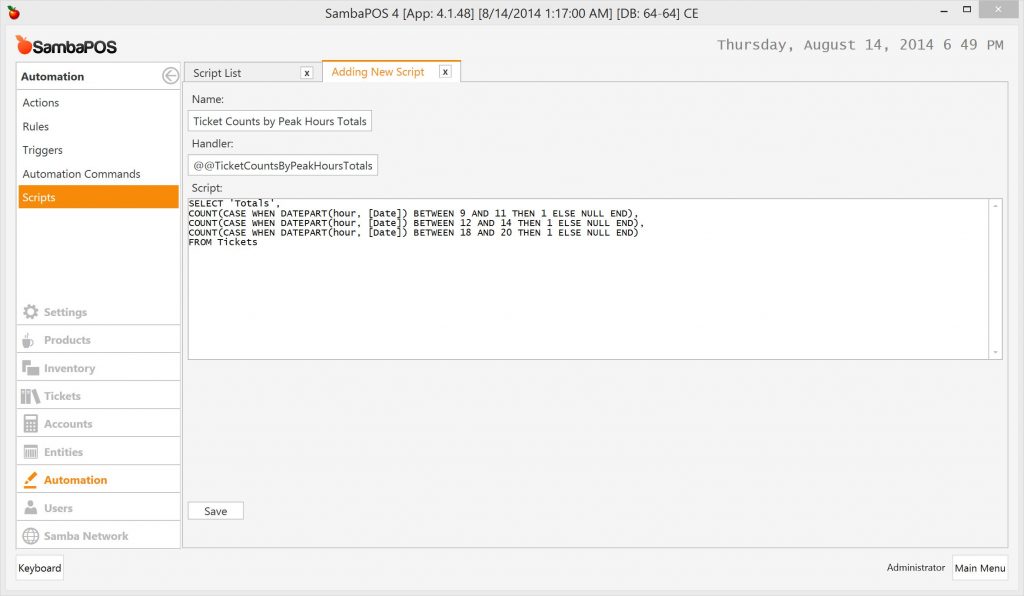
Adding Totals to Report
Use another SQL Script to display a summary footer under table.
SELECT 'Totals',
  COUNT(CASE WHEN DATEPART(HOUR, [DATE]) BETWEEN 9 AND 11 THEN 1 ELSE NULL END),
  COUNT(CASE WHEN DATEPART(HOUR, [DATE]) BETWEEN 12 AND 14 THEN 1 ELSE NULL END),
  COUNT(CASE WHEN DATEPART(HOUR, [DATE]) BETWEEN 18 AND 20 THEN 1 ELSE NULL END)
FROM Tickets
|
You should create a new script and use a different handle for that script. you can access this script with @@TicketCountsByPeakHoursTotals.
… and the report should be updated as shown here.
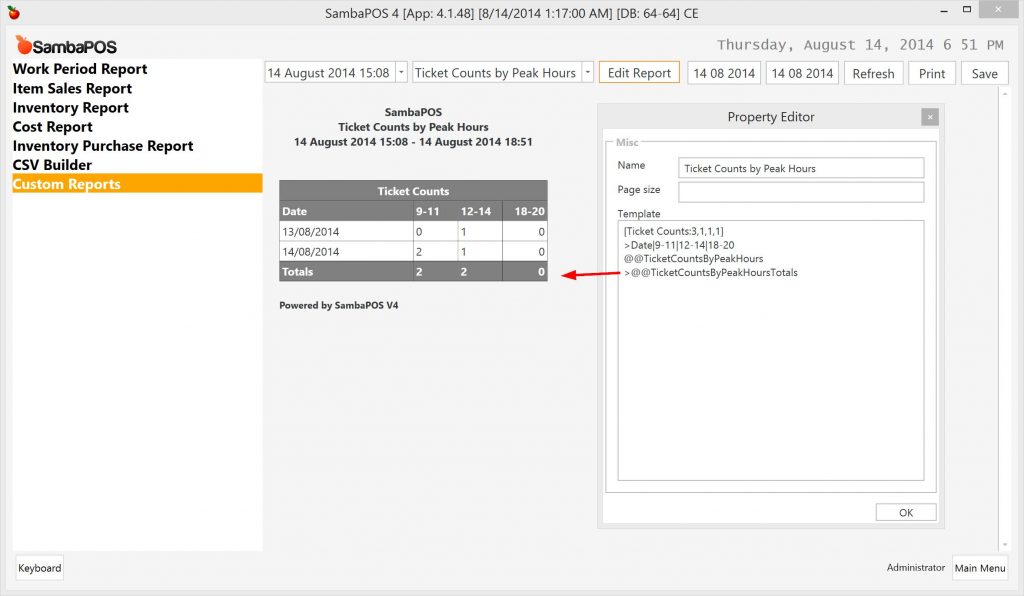
Adding > char in front of the row will convert it to a bold row. For this reason it has been added > char in front of @@TicketCountsByPeakHoursTotals to make it appear as a footer.
Filtering SQL Results by Date
You’ll notice the example SQL script displays results for all tickets and changing dates does no change on values. However it is necessary to see the results for date ranges. To access selected date range from inside SQL Scripts you can use {Start} and {End} tags. Here there is another example.
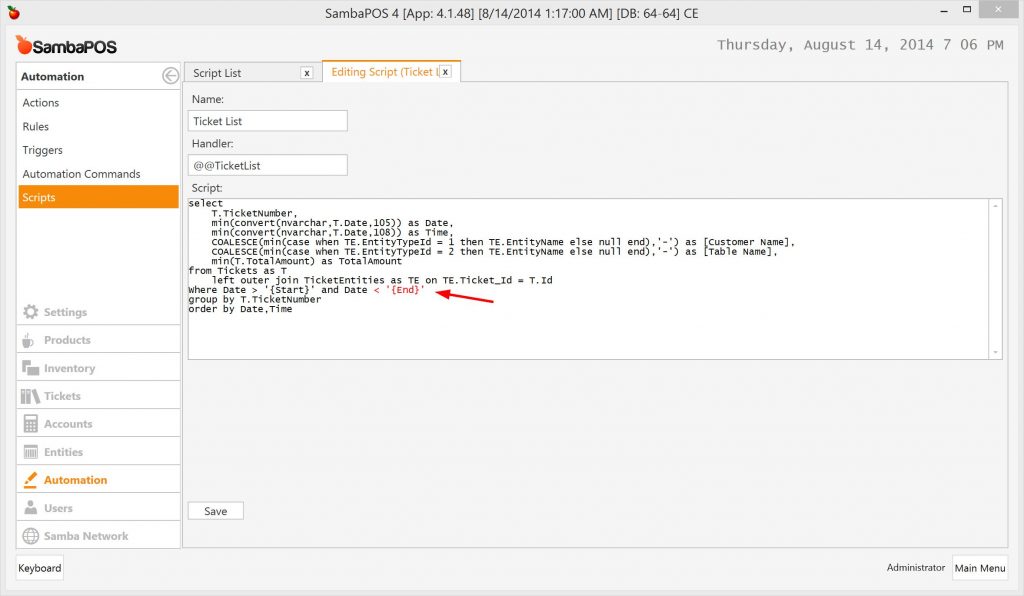
SELECT
    T.TicketNumber,
    MIN(CONVERT(nvarchar,T.Date,105)) AS DATE,
    MIN(CONVERT(nvarchar,T.Date,108)) AS TIME,
    COALESCE(MIN(CASE WHEN TE.EntityTypeId = 1 THEN TE.EntityName ELSE NULL END),'-') AS [Customer Name],
    COALESCE(MIN(CASE WHEN TE.EntityTypeId = 2 THEN TE.EntityName ELSE NULL END),'-') AS [TABLE Name],
    MIN(T.TotalAmount) AS TotalAmount
FROM Tickets AS T
    LEFT OUTER JOIN TicketEntities AS TE ON TE.Ticket_Id = T.Id
WHERE DATE > '{Start}' AND DATE < '{End}'
GROUP BY T.TicketNumber
ORDER BY DATE,TIME
|
This script displays a ticket list. As date tags were included it will display tickets for only selected date range.
Another report will be added by clicking Add Report from report selection drop down. As this table displays 6 columns per row it is necessary to create a 6 column table.
[Tickets:1,2,2,2,2, 2]
>Ticket No|Date|Time|Customer|Table|Amount
@@TicketList
|
The SQL result can be accessed with @@TicketList handle.
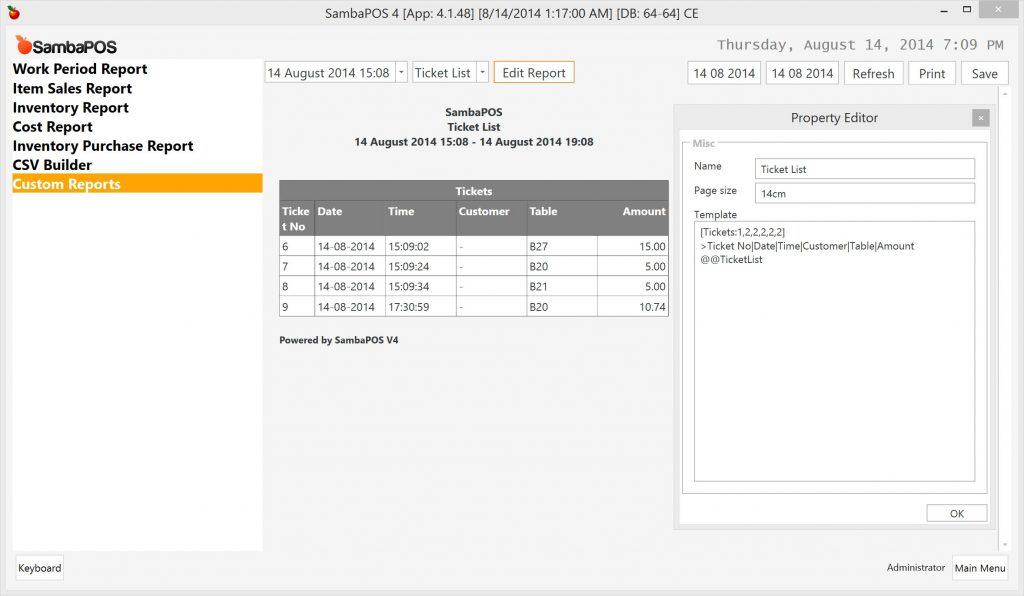
Tip; It has been also set Page Size value in centimeters for better viewing.
Using Parameters in SQL Scripts
SELECT
    T.TicketNumber,
    MIN(CONVERT(nvarchar,T.Date,105)) AS DATE,
    MIN(CONVERT(nvarchar,T.Date,108)) AS TIME,
    COALESCE(MIN(CASE WHEN TE.EntityTypeId = 1 THEN TE.EntityName ELSE NULL END),'-') AS [Customer Name],
    COALESCE(MIN(CASE WHEN TE.EntityTypeId = 2 THEN TE.EntityName ELSE NULL END),'-') AS [TABLE Name],
    MIN(T.TotalAmount) AS TotalAmount
FROM Tickets AS T
    LEFT OUTER JOIN TicketEntities AS TE ON TE.Ticket_Id = T.Id
WHERE DATE > '{Start}' AND DATE < '{End}' AND T.LastModifiedUserName = 'Administrator'
GROUP BY T.TicketNumber
ORDER BY DATE,TIME
|
In this sample it has been added and T.LastModifiedUserName = 'Administrator' part to the Where clause to list tickets only modified by Administrator user. To display the report from multiple users you need to create a separate script for each user as it has been hardcoded user name into script.
Instead of hardcoding user names into script you can configure it as a parameter.
SELECT
    T.TicketNumber,
    MIN(CONVERT(nvarchar,T.Date,105)) AS DATE,
    MIN(CONVERT(nvarchar,T.Date,108)) AS TIME,
    COALESCE(MIN(CASE WHEN TE.EntityTypeId = 1 THEN TE.EntityName ELSE NULL END),'-') AS [Customer Name],
    COALESCE(MIN(CASE WHEN TE.EntityTypeId = 2 THEN TE.EntityName ELSE NULL END),'-') AS [TABLE Name],
    MIN(T.TotalAmount) AS TotalAmount
FROM Tickets AS T
    LEFT OUTER JOIN TicketEntities AS TE ON TE.Ticket_Id = T.Id
WHERE DATE > '{Start}' AND DATE < '{End}' AND T.LastModifiedUserName = '@1'
GROUP BY T.TicketNumber
ORDER BY DATE,TIME
|
It was changed T.LastModifiedUserName = 'Administrator' part to T.LastModifiedUserName = '@1' . @1 means first parameter. If you need to use more parameters you can name them as @2, @3, … etc.
In this report template, it will be passed Administrator value to SQL by typing parameters next to handle name.
[Tickets:1,2,2,2,2, 2]
>Ticket No|Date|Time|Customer|Table|Amount
@@TicketList:Administrator
|
It has been added a colon after @@TicketList handle and typed user name there. It will replace with @1 in SQL as it is first parameter. You can also set a comma separated parameter list so you can access second parameter with @2and third one with @3. After this change the report should show only tickets created by Administrator.
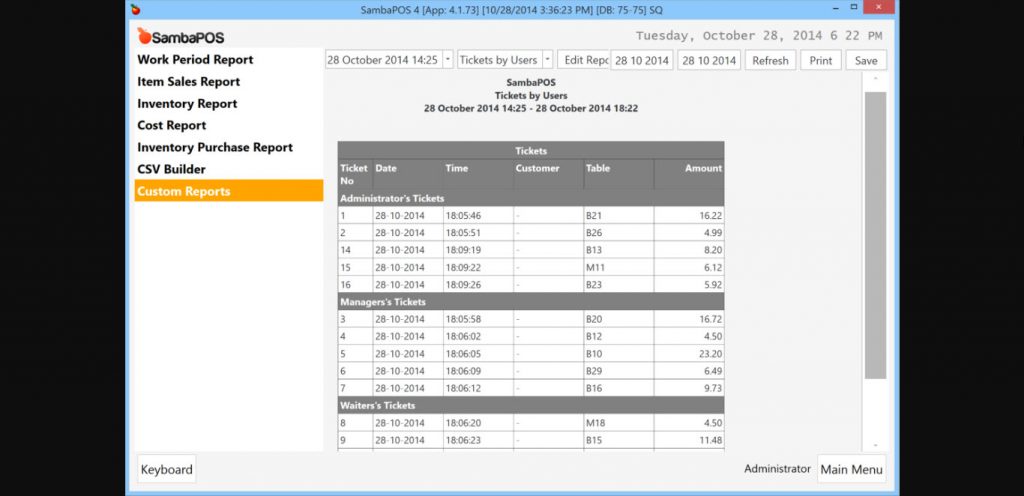
You can create multiple sections for each user. For example it is possible to change this template to include multiple user’s tickets.
[Tickets:1,2,2,2,2, 2]
>Ticket No|Date|Time|Customer|Table|Amount
>Administrator's Tickets
@@TicketList:Administrator
>Managers's Tickets
@@TicketList:Manager
>Waiters's Tickets
@@TicketList:Waiter
|
It will create a beautiful ticket list grouped by user names.
Using Parameter Sources
To simplify this template you can use Parameter Source feature. Instead of duplicating a report section for each user you can define a parameter list for possible values. You can change the template like this:
[Tickets:1,2,2,2,2, 2]
>Ticket No|Date|Time|Customer|Table|Amount
>$1's Tickets
@@TicketList:$1
|
It has been replaced user name references with $1 keyword and deleted other sections. Now it is necessary to configure which values $1 can have. To configure a parameter list a line will be added just before first $1. That line will start @ char and contain a comma delimited list of possible values.
[Tickets:1,2,2,2,2, 2]
>Ticket No|Date|Time|Customer|Table|Amount
@Administrator,Manager,Waiter
>$1's Tickets
@@TicketList:$1
|
@Administrator,Manager,Waiter line defines values for $1 so a separate section will appear for each value inside report. That report will be same with the one that can be seen on the above screen shot.
Instead of typing a parameter list you can use an SQL Script to fetch parameter values. For example if you have a single column SQL script that returns User Names you can use it instead.
[Tickets:1,2,2,2,2, 2]
>Ticket No|Date|Time|Customer|Table|Amount
@ @@GetUserNames
>$1's Tickets
@@TicketList:$1
>Total|@@TicketTotal:$1
|
@@GetUserNames is an SQL Script that returns names from users table.
Select Name from Users
|
After this change, report will display a separate section for each user created in SambaPOS.
In last template it is also included >Total|@@TicketTotal:$1 line to demonstrate how you can include footer totals. @@TicketTotal is also an SQL script that accepts a user name parameter and returns total sum of tickets as a single value.
Tip; You can also use parameter sources for reports you will generate by using Custom Reporting Tags. For advanced grouping features you can find useful information under Custom Report Pivot Table Views section.
Creating User Specific Reports
{UserId} and {UserName} tags replaces with logged user information inside SQL scripts so you can create reports specific to logged in user.
SELECT
    T.TicketNumber,
    MIN(CONVERT(nvarchar,T.Date,105)) AS DATE,
    MIN(CONVERT(nvarchar,T.Date,108)) AS TIME,
    COALESCE(MIN(CASE WHEN TE.EntityTypeId = 1 THEN TE.EntityName ELSE NULL END),'-') AS [Customer Name],
    COALESCE(MIN(CASE WHEN TE.EntityTypeId = 2 THEN TE.EntityName ELSE NULL END),'-') AS [TABLE Name],
    MIN(T.TotalAmount) AS TotalAmount
FROM Tickets AS T
    LEFT OUTER JOIN TicketEntities AS TE ON TE.Ticket_Id = T.Id
WHERE DATE > '{Start}' AND DATE < '{End}' AND T.LastModifiedUserName = '{UserName}'
GROUP BY T.TicketNumber
ORDER BY DATE,TIME
|
This script will always return ticket list for logged in user. So each user will see / print their own report.